
Chart Analysis Game – A Trading Practice Tool for Stock Market Enthusiasts
An open-source Streamlit-based game that helps traders practice chart reading and pattern recognition using real stock data.
1. Introduction
Bridging the Gap Between Theory and Real Market Experience
This Chart Analysis Game is a full-fledged chart reading practice tool that enables traders to hone their market intuition using real stock data.
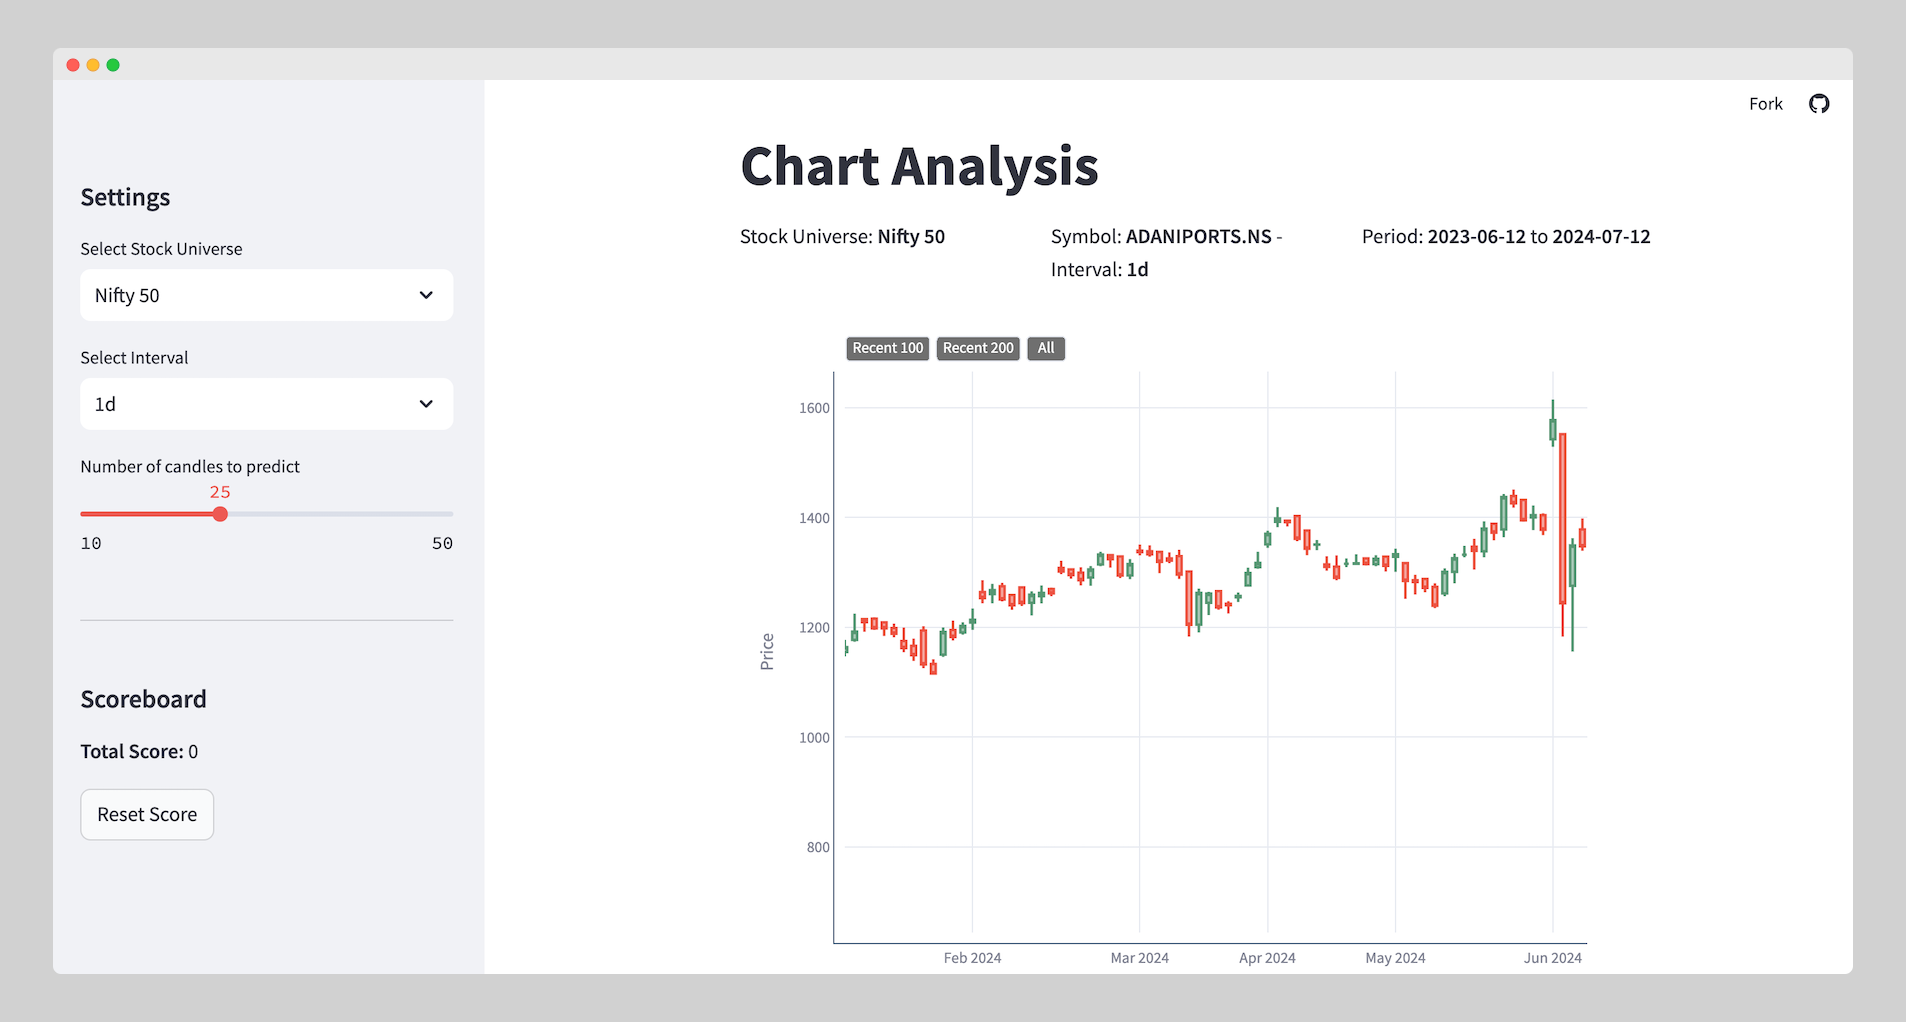
Using yFinance, the game fetches historical market data and randomly selects a chart segment for the user to analyze. The trader must predict the next movement based on historical patterns without seeing any indicators or price action hints.
Play the game - Chart Practice
2. The Concept
Trading is not just about theory-it’s about recognizing patterns, understanding market psychology, and making decisions under uncertainty.
This game simulates real trading scenarios by showing traders a hidden section of historical stock charts and challenging them to predict the next move.
Key Gameplay Elements:
- Users can select their stock universe, such as Nifty 50, ensuring they only get charts from relevant stocks.
- Charts are chosen from any point in the last 3 years, keeping the data both relevant yet unpredictable.
- Players can adjust:
- Timeframe: 5m, 15m, 1h, 1d, etc.
- Prediction range: 10 to 50 candles ahead.
- The score system tracks accuracy, helping users refine their market reading skills over time.
3. Challenges & Innovations
Maintaining Chart State Without Randomization Issues
One major technical challenge was keeping the chart stable after user input. Since Streamlit re-runs the script on every interaction, the chart would initially re-randomize on every input, making it impossible for users to interact effectively.
I solved this issue using session state management, caching mechanisms, and yes-leveraging modern AI tools like ChatGPT and Cursor for debugging. There’s no shame in using AI to speed up development! 😎
4. Tech Stack & Development
The game was built with:
- Streamlit – Rapid web app development for data-heavy applications.
- Plotly – Interactive charts that provide a seamless trading experience.
- yFinance – Reliable stock data fetching.
- Python & Pandas – Data manipulation and backend processing.
Development Highlights:
- Dynamic Chart Selection – Pulls real, historical data for a true market simulation.
- Customizable Trading Universe – Users can choose stock lists like Nifty 50 for focused learning.
- Session-Persistent Charts – Prevents data reshuffling, maintaining a fluid user experience.
5. Future Roadmap
This game is just the beginning. Future plans include:
- Integration into my larger financial research SaaS - we discussed about that in Insider trading app case study.
- Leaderboard & Multiplayer Mode – Compete with friends or fellow traders.
- AI-Powered Feedback – Use ML models to provide suggestions on trade decisions.
- More Customization Options – Add indicators (optional), multiple timeframe views, and additional charting tools.
6. Open Source & Collaboration
As an open-source project, developers can fork, modify, and improve this game. Streamlit made it possible to develop and deploy this tool in just a day, showing how powerful it is for rapid data app development.
If you’re a trader, developer, or entrepreneur looking for a custom-built data visualization tool, let’s collaborate! 🚀
7. Work With Me
Want to build something similar for trading, finance, or interactive data analysis? I specialize in Streamlit, data-driven apps, and financial tech solutions. Let’s build your next project together! 💡
📩 Reach out for collaboration!