Chart Analysis Game – A Trading Practice Tool for Stock Market Enthusiasts
1. Introduction
Bridging the Gap Between Theory and Real Market Experience
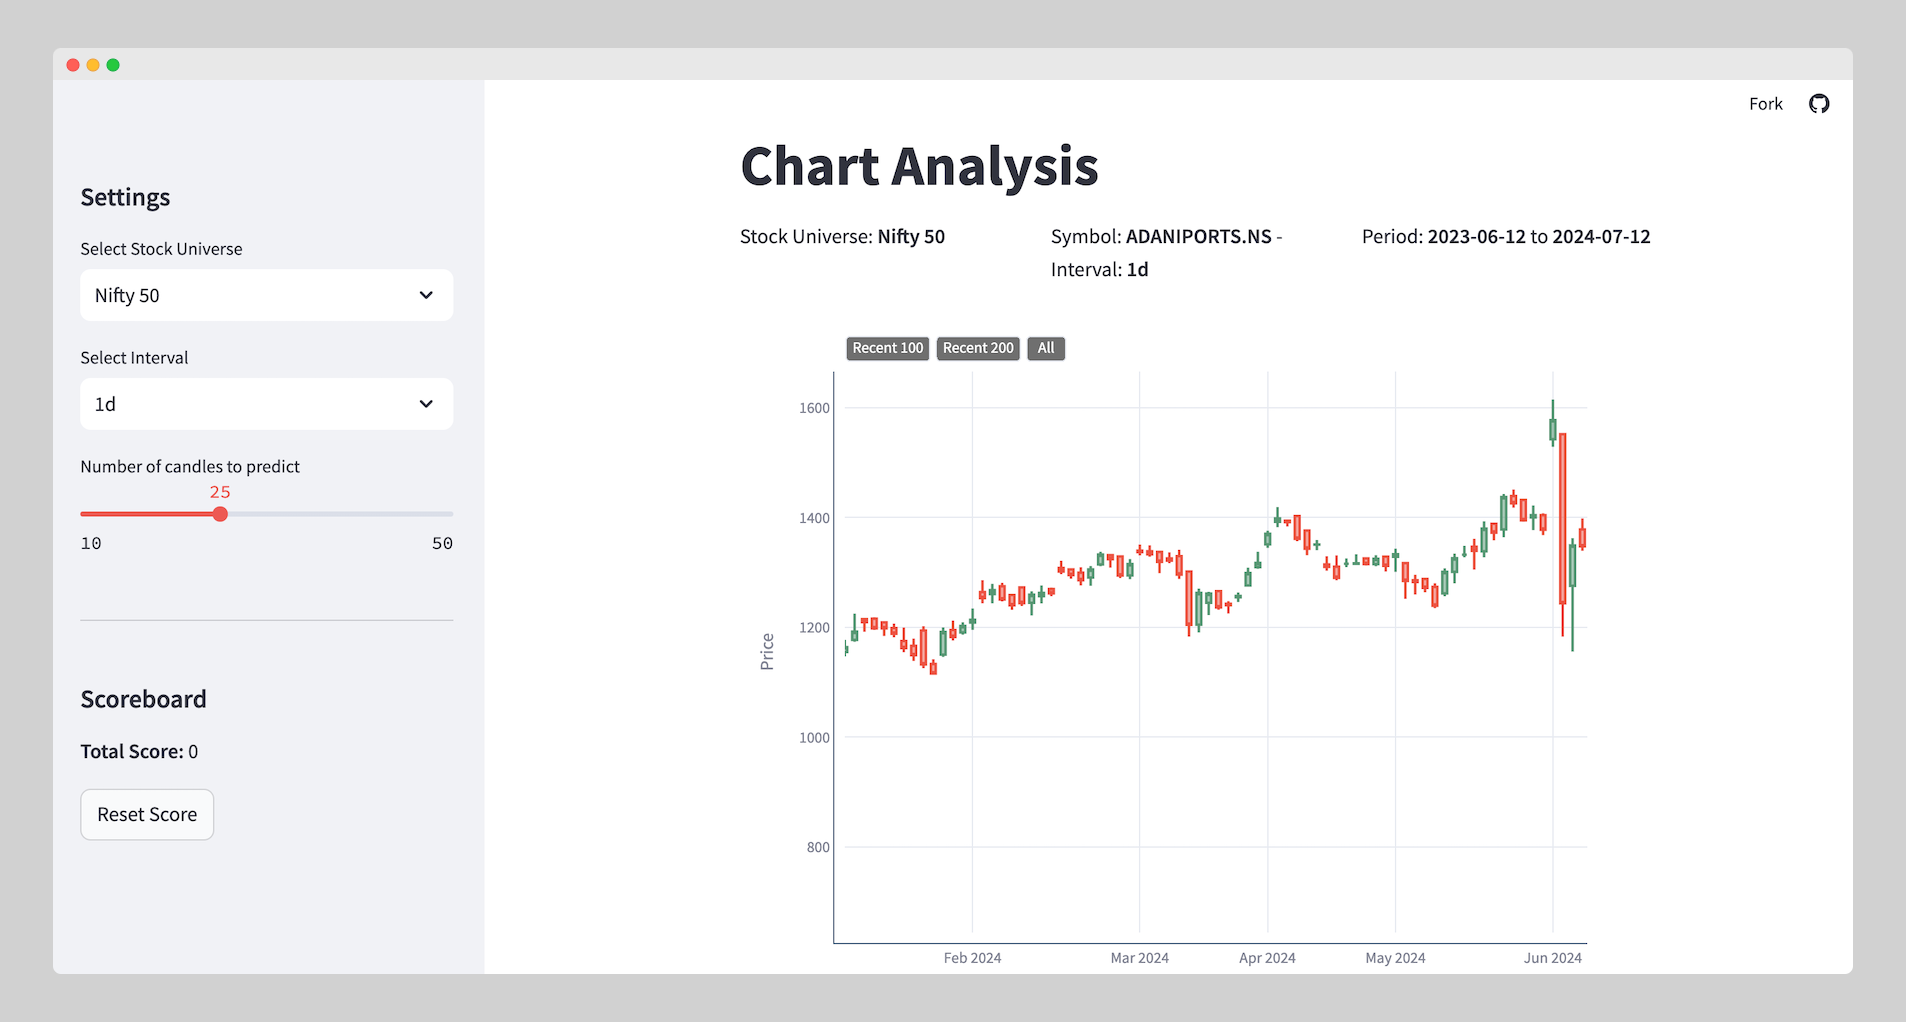
This Chart Analysis Game is a full-fledged chart reading practice tool that enables traders to hone their market intuition using real stock data.
Using yFinance, the game fetches historical market data and randomly selects a chart segment for the user to analyze. The trader must predict the next movement based on historical patterns without seeing any indicators or price action hints.
Play the game - Chart Practice
2. The Concept
Trading is not just about theory-it’s about recognizing patterns, understanding market psychology, and making decisions under uncertainty.
This game simulates real trading scenarios by showing traders a hidden section of historical stock charts and challenging them to predict the next move.
Key Gameplay Elements:
- Users can select their stock universe, such as Nifty 50, ensuring they only get charts from relevant stocks.
- Charts are chosen from any point in the last 3 years, keeping the data both relevant yet unpredictable.
- Players can adjust:
- Timeframe: 5m, 15m, 1h, 1d, etc.
- Prediction range: 10 to 50 candles ahead.
- The score system tracks accuracy, helping users refine their market reading skills over time.
3. Challenges & Innovations
Maintaining Chart State Without Randomization Issues
One major technical challenge was keeping the chart stable after user input. Since Streamlit re-runs the script on every interaction, the chart would initially re-randomize on every input, making it impossible for users to interact effectively.
I solved this issue using session state management, caching mechanisms, and yes-leveraging modern AI tools like ChatGPT and Cursor for debugging. There’s no shame in using AI to speed up development! 😎
4. Tech Stack & Development
The game was built with:
- Streamlit – Rapid web app development for data-heavy applications.
- Plotly – Interactive charts that provide a seamless trading experience.
- yFinance – Reliable stock data fetching.
- Python & Pandas – Data manipulation and backend processing.
Development Highlights:
- Dynamic Chart Selection – Pulls real, historical data for a true market simulation.
- Customizable Trading Universe – Users can choose stock lists like Nifty 50 for focused learning.
- Session-Persistent Charts – Prevents data reshuffling, maintaining a fluid user experience.
5. Future Roadmap
This game is just the beginning. Future plans include:
- Integration into my larger financial research SaaS - we discussed about that in Insider trading app case study.
- Leaderboard & Multiplayer Mode – Compete with friends or fellow traders.
- AI-Powered Feedback – Use ML models to provide suggestions on trade decisions.
- More Customization Options – Add indicators (optional), multiple timeframe views, and additional charting tools.
6. Open Source & Collaboration
As an open-source project, developers can fork, modify, and improve this game. Streamlit made it possible to develop and deploy this tool in just a day, showing how powerful it is for rapid data app development.
If you’re a trader, developer, or entrepreneur looking for a custom-built data visualization tool, let’s collaborate! 🚀
7. Work With Me
Want to build something similar for trading, finance, or interactive data analysis? I specialize in Streamlit, data-driven apps, and financial tech solutions. Let’s build your next project together! 💡
📩 Reach out for collaboration!